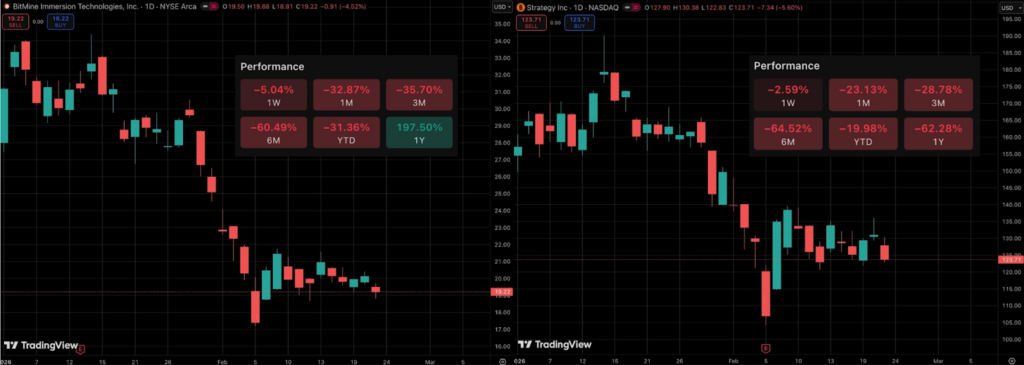
That said, financial reflexivity does not only work on the way up. Ever since the October 10th leverage unwind, the crypto market has structurally tilted to the downside with total market cap falling by over 50%. Assets like Bitcoin and Ethereum, which makes up the bulk of digital asset treasuries, are now down over 25% and 38% respectively. This downturn has thereby prompted serious questions around the sustainability of this model.
The reality is that when crypto prices fall, equity valuations can compress, premiums can vanish and access to cheap capital can tighten. The volatility around the stock prices of the two largest DATs, Strategy and BitMine, is indicative of how closely these equities can track shifts in crypto sentiment.
This article looks into the risks associated with the DAT model, not from the standpoint of whether crypto itself will succeed, but from the perspective of capital structure and balance sheet stability.
Reflexivity Cuts Both Ways
In a rising market, higher crypto prices lift the value of treasury holdings, which can push the stock price higher and make raising capital easier. This is the part of the cycle that many have gotten accustomed to since the DAT trend really took off last year. What is not discussed enough however is how the same loop works in reverse.
When crypto prices fall, the value of the company’s holdings fall too. Since many investors see the company as a way to get exposure to crypto, the stock price usually drops as well. Think of it like this: say a company holds $1 billion in Bitcoin and BTC drops by 20%, the value of this holding now drops to $800 million. Investors immediately factor that into how they view the company. If the company’s identity is closely tied to their crypto exposure, the stock often reacts quickly.
There’s also a second layer. In bull markets, investors may be willing to pay extra (a premium) for that exposure. In a downturn, they become more cautious. That premium can shrink because:
- Confidence falls
- Risk appetite drops
- Investors prefer to own the asset directly rather than the wrapper
So the stock doesn’t just fall because the crypto holding falls in value. It can fall because the narrative premium attached to it compresses at the same time.
This is where the reverse reflexivity paradigm comes into effect. In a declining market, raising money simply becomes a lot more difficult for DATs. If the stock price has fallen, the company would have to sell more shares to raise the same amount of money. This effectively means that existing shareholders would own a smaller piece of the company.
Adding to this, borrowing can also become tougher. When there is uncertainty around markets and prices are in a drawdown, lenders see more risk. To compensate for that risk, they usually ask for higher interest rates. This is the paradox of the DAT model. Money that was once cheap and easy to access becomes expensive and harder to secure.
Leverage and Debt Funded Accumulation
Many Digital Asset Treasury companies do not rely on cash alone to buy crypto. These public companies often use convertible bonds, structured financing or other equity linked instruments to raise money and accumulate crypto. This works fine when crypto prices are rising as the value of the assets increases while the debt stays manageable. However this same structure has a built-in mismatch which becomes clearly visible when prices take a turn to the downside. Bitcoin, Ethereum or others are inherently volatile assets. The liabilities these DATs take on, such as debt repayments, are fixed and must be honoured regardless of market conditions.
When crypto prices fall sharply like they have recently, the value of the company’s holdings drop alongside this while its debt stays intact. The company still has to adhere to interest payments and repayment deadlines, even though the assets backing that debt are worth less. This ultimately puts pressure on the company’s balance sheet. When we look at traditional treasury management, assets are usually stable and predictable. In the DAT model, volatility sits on the asset side, which means swings in price can amplify both gains and losses for the company.
NAV premium compression
Another important pressure point to understand within the entire DAT model is something called NAV, or net asset value. This basically measures the value of the crypto a company holds on its balance sheet. If a company holds $1 billion in cryptocurrencies and its stock market value is higher than that, the stock is said to be trading at a premium. In this scenario, issuing new shares becomes lucrative because the company is raising more money than the value of the assets backing each share. On the flipside, if the stock falls below the value of its holdings, issuing new shares does the opposite as it forces the company to sell equity at a discount, which weakens existing shareholders.
We’ve seen how premiums can go up quickly during bull markets. However, these premiums can shrink just as fast when sentiment shifts and prices fall. When this declines, growth becomes harder. Apart from the company’s ability to raise capital slowing down, investors may question the model and management may be pushed into a more defensive stance.
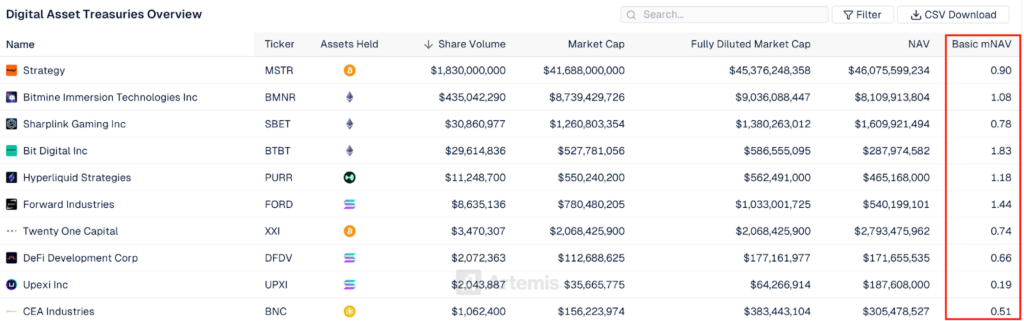
Now when we look at the current scenario, it’s clear that the market is no longer assigning blanket premiums to all DAT companies. Instead, it appears to be pricing them based on perceived balance sheet strength, execution ability and sustainability of the model.
Innovation with Embedded Volatility
The DAT model is a real shift in how capital markets interact with cryptocurrencies. They have turned digital asset exposure into a corporate strategy, using equity and debt markets to accumulate positions. However, for all the pros this model carries in a bullish environment, the inverse impact of this model is coming to light as crypto goes through a deep correction.
There is a clear takeaway in that these public companies are building capital structures around crypto rather than simply holding it. This means the risk does not only come from crypto prices going up or down but how those changes affect the company’s debt levels, share issuance and ability to raise money.
Now for those looking at this model from within the crypto space, the natural question is whether this has the potential to cause a further unwind in prices of assets across the board. If some of the largest DAT companies have debt coming due, run short on cash or struggle to borrow again during a downturn, they may be forced to slow their buys, or in tougher situations, sell a portion of their crypto from their balance sheet. Therefore, there is a likelihood that this could cause more downside but this does not automatically imply a contagion or a systemic collapse across all DATs.
]]>However, over the past few years and especially since last year, corporate treasury management has taken on a new meaning altogether. Publicly listed companies have not shied away from using their balance sheets to gain exposure to cryptocurrencies such as Bitcoin, Ethereum and other altcoins.
We’re not talking about a portion being allocated but a noticeable trend in companies adopting the so-called digital asset treasury, or DAT for short, as their primary treasury strategy. In other words, this type of treasury strategy is flipping the status quo of the preservation first mindset to seeing their treasury as an active investment engine. These DAT companies view cryptocurrencies as investments that will grow significantly over time and ultimately benefit the company’s balance sheet, investor appeal and long term growth narrative.
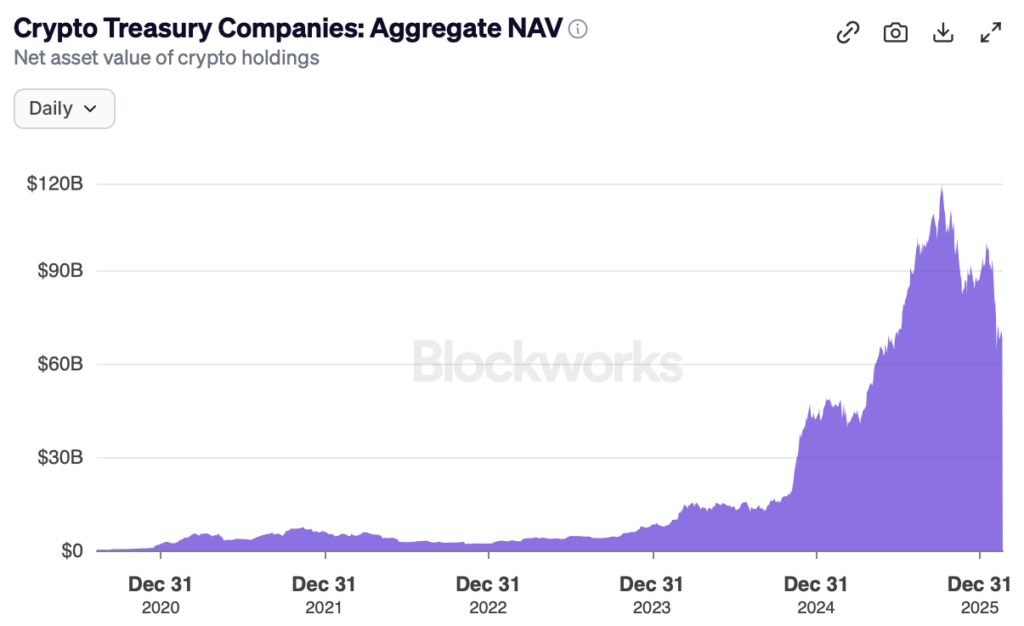
Over the past two years, around 30 companies have transformed to DATs and today they hold cryptocurrencies worth over $69 Billion. The acceleration of this trend has however put forth an uncomfortable but important question to the table. Can these companies be seen as businesses with a treasury on the side or are they a type of leverage instrument to hold and accumulate crypto?
Before answering this question and looking at the advantages and risks associated with this model however, it’s important to break down the mechanism and understand how the crypto treasury feedback loop actually works in practice.
How the Crypto Treasury Flywheel Works
The reason why companies like Strategy, Bitmine and others are flocking to add digital assets to their balance sheets is because of something called the crypto treasury flywheel. Essentially, it is a feedback loop that is extremely lucrative when market conditions are favourable. Let’s break it down step by step to understand how this works:
Step 1: A public company decides to buy and hold crypto in its treasury
The process starts with a public company using part of its cash reserves to buy digital assets like Bitcoin, Ethereum or other altcoins. Traditional investors see this as an avenue to get exposure to crypto via a regulated public company.
Step 2: If and when crypto prices go up, the company’s balance sheet looks stronger
When the crypto holdings go up in value, this props up the company’s value too. The fact is that an upside trajectory in their holdings essentially makes the company look “richer” on paper. This, in turn, often improves sentiment around the stock. As investors anticipate future accumulation and momentum, in bull markets, this can result in the company’s stock rising more than the underlying crypto.
Step 3: The stock starts trading at a premium and that premium becomes useful
This is a key inflection point in the entire flywheel journey. If the market values the company higher than the value of its crypto holdings (and its business), the company is now trading at a premium. Think of it in this way: the market is essentially saying “we’ll pay extra for this wrapper because it gives us easy exposure”. This is where you come across the term multiple of Net Asset Value or mNAV for short. This is basically a yardstick to measure whether at a premium or discount to the value of its crypto holdings. If mNAV = 1.0, this means the company is trading in line with the value of its crypto. If mNAV = 2.0, this tells you the company is trading 2x the value of its holdings and anything below 1.0 is indicative of a discount.
Step 4: The company raises money using that higher stock price
Once the stock is up, the company can raise capital more easily. This can be done in two common ways:
- Issue shares (sell new stock to investors)
- Issue debt (borrow money)
This is where something called convertible bonds come in.
Step 5: Convertible bonds enter the picture
The easiest way to understand convertible bonds is as a loan that can be turned into shares later. Investors like this instrument because if the stock goes up in value, they can convert and benefit like shareholders. On the other hand, if the stock does not accrue in value, they still hold a bond that should get repaid.
For investors, it’s a way to gain exposure on upside without taking full equity risk. For the company, it can be a cheaper way to borrow than a regular bond, especially when investor sentiment is strong and the stock is trading at a high mNAV.
Step 6: The company uses that new money to buy more crypto
This is when the flywheel really gets into motion. The company uses the capital it raised (via shares or convertibles) and buys more digital assets. That increases crypto holdings per share, makes the narrative stronger and can potentially push the stock higher.
Step 7: Repeat
The feedback loop then enters a self perpetuating cycle of buying crypto to stock rising to raising money to buying more crypto. A key point here is that this flywheel really depends on confidence and price momentum within the underlying crypto asset. Raising money can become harder if the stock trades below its premium and this ultimately can slow down, or worse, cause an inverse impact on the loop. This is why the DAT strategy has often been questioned as a risky endeavour. Although the purpose of this blog is to introduce the mechanism rather than get into the downsides, it’s important to acknowledge the basic structural vulnerability.
The Origin Story and Where We are Now
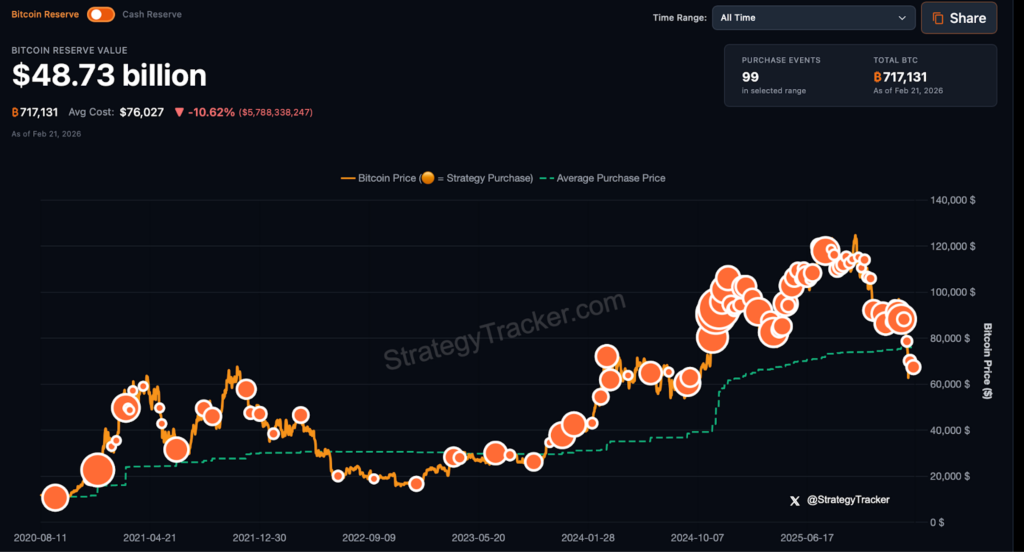
The first public company crypto treasury move came in August 2020 when Strategy (then Microstrategy) publicly disclosed a $250 million purchase of BTC (about 21,454 BTC at the time). Fast forward to February 2026, Strategy is now by far the largest DAT holding 717,131 BTC or 3.41% of Bitcoin’s total supply across 99 separate buy orders.
What began as a Bitcoin-first strategy has since evolved into something broader. Once the market saw that balance sheets could be used as vehicles for digital asset exposure, it was only a matter of time before the model expanded beyond a single asset. The logic was simple: if the flywheel works for Bitcoin, it can theoretically work for other large, liquid crypto networks as well.
Today, public companies are accumulating and building treasuries in other major cryptocurrencies too, especially Ethereum and Solana. This DAT model of going beyond a Bitcoin-first strategy really came into effect last year when public companies like BitMine and SharpLink began aggressively adding ETH to their treasuries.
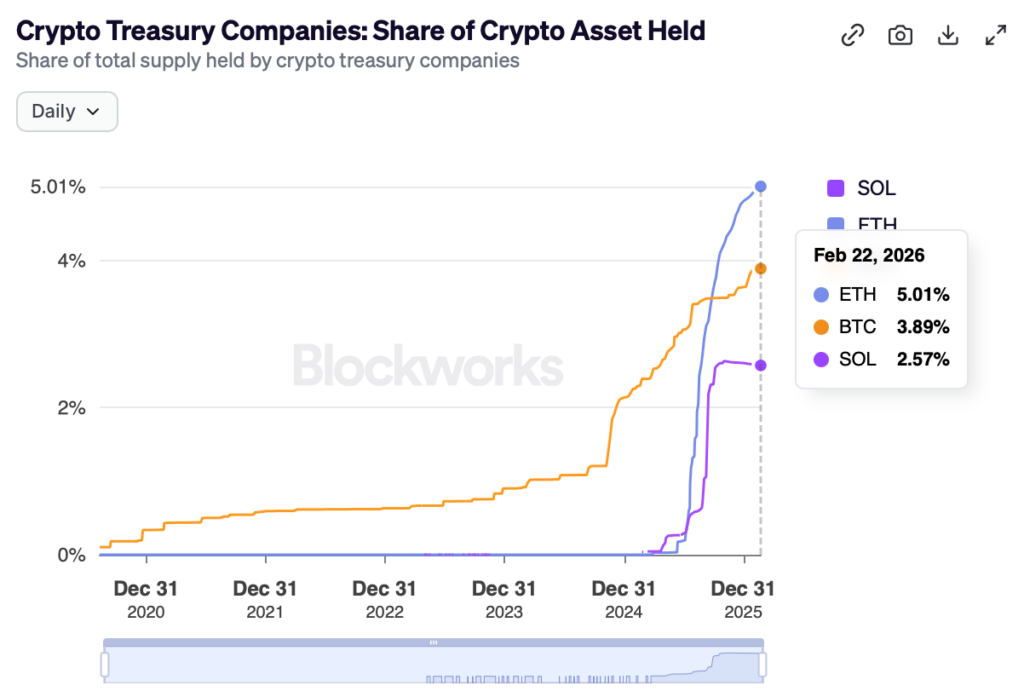
We can see this big shift by looking at the speed at which these companies have absorbed the supply of these assets. At the time of writing, public companies hold 2.57% of Solana’s total supply and Ethereum at over 5%. A reality that simply did not exist even if you look back just a year ago. Beyond these two networks, there are companies also accumulating other large cap layer 1 networks such as BNB, HYPE and SUI.
Why Investors Buy the Wrapper Instead of the Asset
A natural question that follows is simple: if investors want exposure to crypto, why not just buy the asset directly? The answer lies in structure. Public companies offer a regulated, familiar wrapper that fits neatly into traditional brokerage accounts and institutional mandates. Investors can gain exposure through equities or bonds without dealing with custody, wallets, or exchange risk. For many funds, that convenience alone is enough to justify buying the stock instead of the token.
There is also a strategic element at play. Some investors believe the wrapper can outperform the underlying asset when the flywheel is working. If a company is able to raise capital at a premium and accumulate more crypto per share, the equity can move more aggressively than the asset itself. In that sense, investors are not just buying Bitcoin or Ethereum, they are buying a capital allocation strategy layered on top of it.
However, with the recent downturn in crypto markets, this model is being questioned and rightly so. When prices fall and premiums compress, the flywheel loses momentum. Raising capital becomes harder, dilution risk increases, and the gap between the wrapper and the asset narrows. This does not mean the DAT model disappears, but it does force investors to reassess its sustainability. A follow-up article will examine these structural risks in detail and explore what happens when the flywheel slows down.
]]>
The timing was certainly not coincidental. These drills come alongside U.S. military deployments in the region and ongoing disagreements over Iran’s nuclear programme, sanctions relief and regional influence. Negotiations have been firm from both sides with Iran warning it is ready to retaliate against any aggression while the U.S. has hinted that military options remain on the table if diplomacy fails.
Even though the missile launches weren’t part of any active conflict, any activity in the Strait of Hormuz gets alarm bells ringing worldwide. With around 20% of global shipments passing through this key passage, any tensions within this region becomes a reminder of how delicate this region is and how easily there can be ripple effects across oil prices, inflation, and financial markets worldwide, including crypto.
Why the Strait of Hormuz Matters to Global Markets
The Strait of Hormuz is a narrow shipping lane in the Middle East and one of the most important energy chokepoints in the world. This region roughly sees around 20 million barrels of oil pass by per day, thereby accounting for nearly 20% of world’s petroleum supply. Therefore, any conflicts or disruptions in this route automatically raises concerns about energy supply around the globe and questions are raised about broader economic stability.
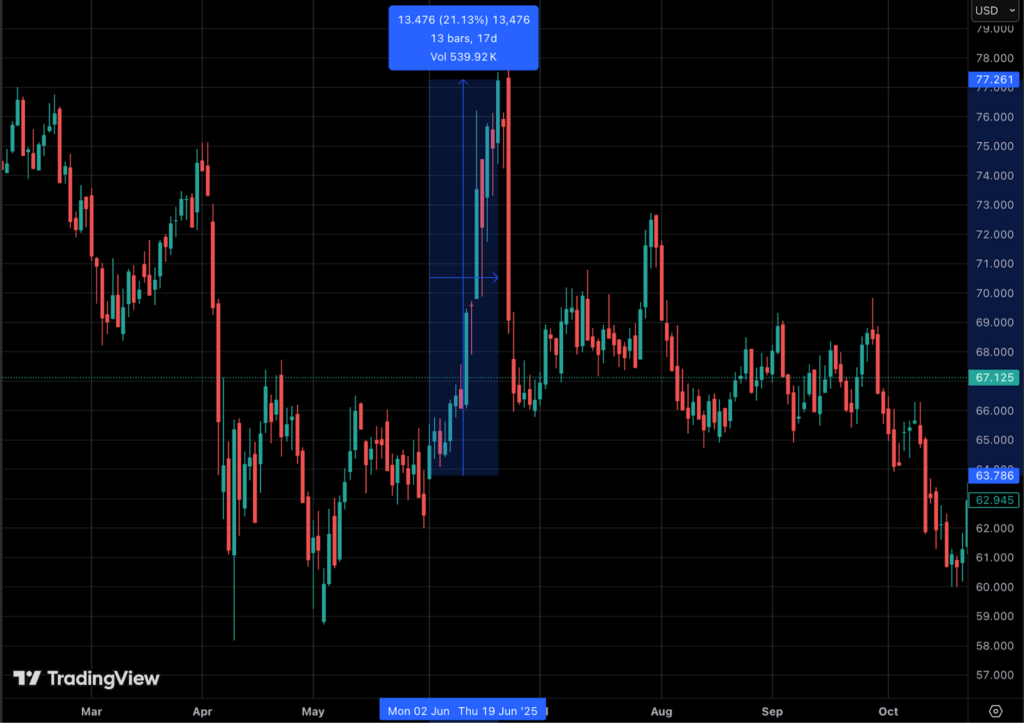
The fact is, even a threat of disruption is enough to push buyers to look for alternative supply from other oil-producing regions and tap into existing stockpiles. Both responses typically come with higher costs, which pushes oil prices up and increases volatility. Previous instances of uncertainty in this region have shown how quickly oil markets react. For example, escalation here last year in June between the U.S. and Iran resulted in oil prices rising a staggering 21% from around $63 to $77 in a matter of days.
Ultimately, oil is a core input for the global economy and any disruption to the trade can have a knock on effect into financial markets and assets worldwide.
Oil and Inflation Expectations Being Repriced
When oil prices rise, they tend to have a domino effect across transportation, manufacturing and food costs, gradually filtering through supply chains and into consumer prices. This transmission does not happen overnight; there is typically a lag before higher energy costs show up in inflation data such as the Consumer Price Index (CPI). As businesses absorb rising input costs, they eventually pass them on to consumers, which is why energy-driven inflation often unfolds over months rather than days.
As inflation expectations increase, financial markets begin reassessing this risk almost instantly. In response, bond yields often rise as investors anticipate tighter monetary policy, equities can face pressure from higher costs and slower growth projections and assets like crypto can turn volatile as the general economic outlook and liquidity is reassessed.
Central Bank Policy Implications
The chances of rising inflation puts central banks in a peculiar and uncomfortable position. If inflation tends to trend higher, policymakers may be forced to delay interest rate cuts or keep borrowing costs higher for longer. In financial markets, this shift from dovish to a hawkish stance is closely watched by investors because it directly shapes the overall direction of global liquidity.
Another corollary is that higher interest rates often strengthens the U.S. dollar as investors go in search for higher yielding and safer assets. A rising dollar and tighter liquidity are a combination that does not bode well for global markets, especially crypto.
Crypto’s Increasing Macro Correlation
Over the past few years, Bitcoin has become noticeably more sensitive to macro shocks, particularly during periods of tightening financial conditions or market stress. Research shows its correlation with major equity indices has risen significantly alongside institutional adoption and broader participation from traditional investors. In fact, correlations with major growth stocks have increased markedly following key milestones such as Bitcoin ETF launches and corporate treasury adoption, highlighting how the asset is becoming more integrated into global financial markets. At the same time, Bitcoin still retains unique drivers, such as its fixed supply and halving cycle, meaning it does not move in lockstep with traditional assets at all times.
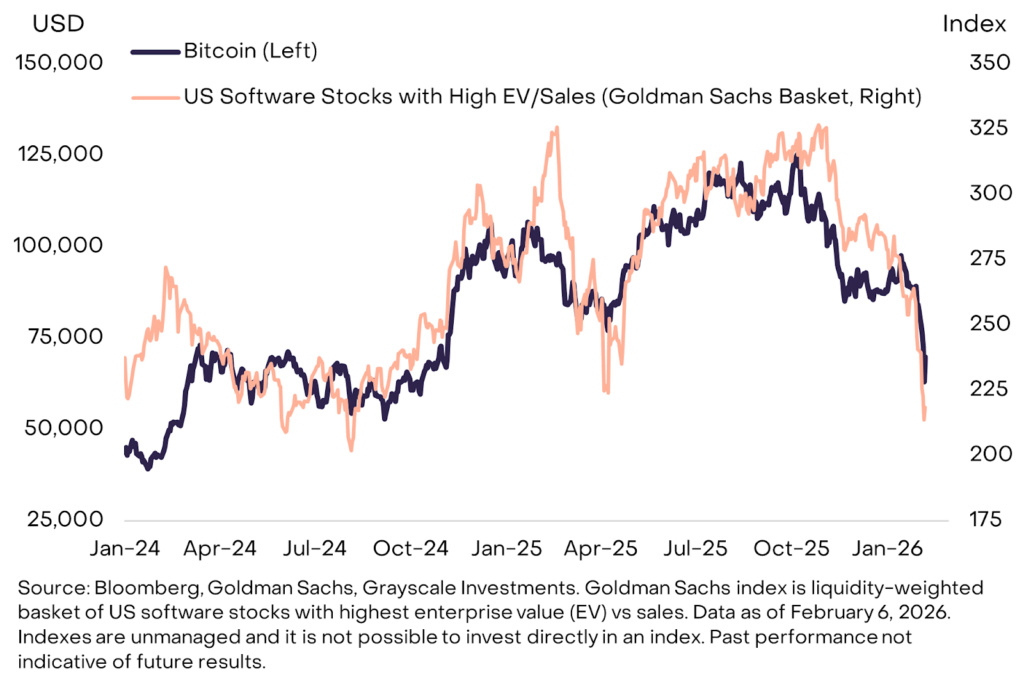
A key reason for this growing sensitivity is the liquidity-driven nature of crypto markets. Bitcoin increasingly responds to global capital flows and monetary policy cycles, especially as ETFs and institutional portfolios make access easier and more familiar for traditional investors. This deeper integration means crypto now sits closer to the broader financial system: it can behave like a macro-sensitive asset in the short term while still maintaining distinct long-term characteristics tied to adoption, technology, and network growth.
What Traders are Watching Next
For now, this is still a developing macro story which deserves close attention for coming days to weeks. Any change in escalation to de-escalation during times like these can quickly have an effect on market sentiment. Recent reports indicate that Iran has offered partial nuclear concessions in ongoing talks, including a proposal to pause uranium enrichment for a limited period and send part of its highly enriched stockpile abroad in return for sanctions relief. The primary demand from the U.S. to completely halt enrichment however remains on the table and this is the point of contention that still needs to be played out.
Apart from geopolitics, traders will need to keep a close eye on the U.S. dollar and bond yields as this will provide some clarity on how markets are seeing risk. The DXY had a sharp wick yesterday following yesterday’s news but ultimately more news filtering will be needed to confirm a more definitive trend.
]]>Thanks to this expansion, clients have access to a wide range of strategies. Some prefer to focus on short-term trading, using assets that provide dynamic opportunities for making deals, while others choose long-term investments focused on stable growth. Regardless of the chosen approach, the availability of a large number of options makes it possible to find optimal solutions for each market participant. Thus, platform users can create balanced portfolios that match their individual financial plans.
In addition, the availability of various assets allows for flexible management strategies. Clients can analyse trends, take into account market indicators, and use advanced analytical tools for decision-making. The availability of many investment areas makes the trading process more convenient and efficient.
Support at Every Stage
To ensure that clients can make the most of new opportunities, Unionmark Investia Holdings offers the assistance of a team of professionals. The specialists are ready to provide useful recommendations to both beginners and experienced investors. Those who are just learning how to trade receive detailed strategies and personalised advice, while experienced users can use additional analytical materials to improve their approaches. The high qualifications of the company’s experts make their recommendations especially valuable.
In addition, the team of specialists provides a comprehensive analysis of the current market situation, helping clients make informed decisions. An important element of working with clients is a personalised approach that takes into account the level of training and individual financial goals of each investor. Regardless of the experience, platform users can count on professional support and high-quality analytics.
Clients can familiarise themselves with various learning information that helps them deepen their knowledge and better understand the specifics of trading. For the convenience of users, detailed materials are provided, covering the most important aspects of working with financial instruments.
Innovative Trading Platform
Unionmark Investia Holdings provides its clients with access to a modern platform that is characterised by high speed and stability. It is designed to offer convenient access to the market from any device. This allows users to respond instantly to current trends and use all the opportunities for profitable transactions. The platform interface is intuitive and adapted for various levels of training. It provides flexible analysis tools, charts, indicators and other functions that contribute to effective trading.
Additionally, the platform offers the ability to customise the trading space to individual needs. Users can adapt the interface, choosing convenient tools. Thanks to this, each investor gets the opportunity to use the platform as efficiently and comfortably as possible.
Results
The expansion of the list of assets, professional support and a convenient platform create optimal conditions for effective trading for Unionmark Investia Holdings clients. The company is constantly working to offer only the most popular and relevant solutions, helping investors achieve their financial goals.
Thanks to a comprehensive approach to service development, Unionmark Investia Holdings provides access to a variety of assets and creates conditions for comfortable and effective trading. Regardless of the level of training, each client receives tools that allow them to effectively manage their investments and use all available opportunities in the financial market. Unionmark Investia Holdings continues to improve its platform and expand its range of services, offering clients even more tools to achieve financial success. Functionality development, analytical support and a wide selection of assets make trading convenient and accessible for every user.
]]>
However, with momentum turning toward the downside over the past four weeks, the growing likelihood of this pattern breaking is raising serious questions about whether this is a regime shift or just a temporary anomaly.
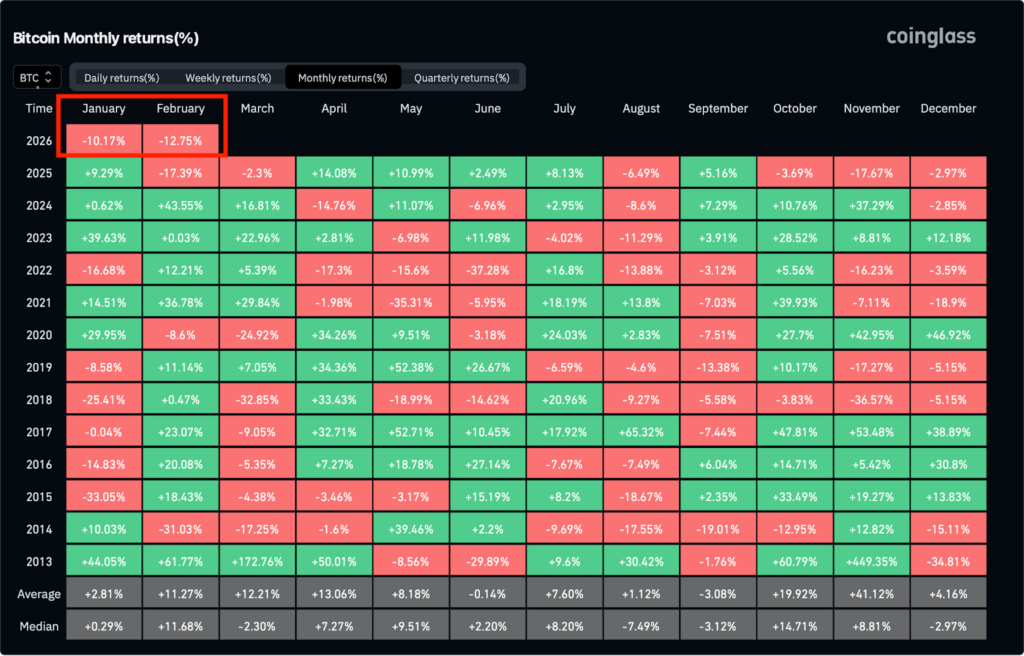
Q1 has so far been unforgiving for the largest and oldest crypto asset. From the start of the year to today, price has fallen roughly -22%, marking the weakest start to a year since 2018. February in particular has carried the bulk of the drawdown, with Bitcoin down 12.75% for the month. This makes it the third-largest February decline in Bitcoin’s history. The picture looks bleak on the surface as this adds to the idea that something is structurally broken in Bitcoin’s price action.
However, zooming into seasonality trends alone misses the bigger picture. Throughout Bitcoin’s history, sharp drawdowns of over -75% post all time highs are common. Currently, even though sentiment might’ve reached an all time low and on-chain flashing signs of pain, Bitcoin sits at around a 45% correction. The important question here becomes what forces are driving the current sell off and whether this correction still fits within the range of typical post ATH corrections, both in terms of cycle duration and on-chain behaviour.
How Rare is a Red January and February?
The fact is Bitcoin has never registered two monthly red candles at the start of the year. The closest it got to printing such a pattern was back in 2018 which ultimately went on to become a prolonged bear market until December of that year when BTC bottomed at around $3100.
What’s different and interesting this time around is where we sit in the post ATH timeline. Bitcoin is already roughly four months into a correction since posting the ATH in October, meaning this rare early-year weakness is appearing after an already ongoing correction. In contrast, the 2018 decline had only begun following the December 2017 peak.
This distinction is important because historically, weak starts to the year have often appeared during late-cycle unwinds or during the transition into a longer bear phase. The current scenario, however, is noticeably different and hence sits in an ambiguous middle ground. Early-year weakness is emerging after several months of prior downside, raising the key question of whether the market is still progressing through a typical post-ATH correction or already moving closer to the later stages of a bottoming out phase.
February’s Historical Strength Explained
A reason for why this pattern is historically very rare is that February is usually a bullish month for Bitcoin for a myriad of reasons. The answer lies less in simple seasonality and more in a mix of positioning resets, liquidity cycles and, more recently, institutional flows.
One of the most influential factors is the post-January positioning reset. January often acts as a month for rebalancing portfolios and tax-driven selling, especially after a bullish quarter four. This tends to front run volatility and profit taking in the first few weeks of the year and February usually becomes the period where selling pressure reduces and risk appetite gradually returns.
Another factor that often comes into play is the Chinese New Year Liquidity cycle. Historically, liquidity conditions in Asia tighten ahead of the holiday period and begin to normalize afterward. As trading activity resumes and capital flows return to risk assets, Bitcoin has frequently benefited from improved demand during February and early March. While this effect is difficult to quantify precisely, the pattern has appeared consistently enough to become a widely observed seasonal tailwind.
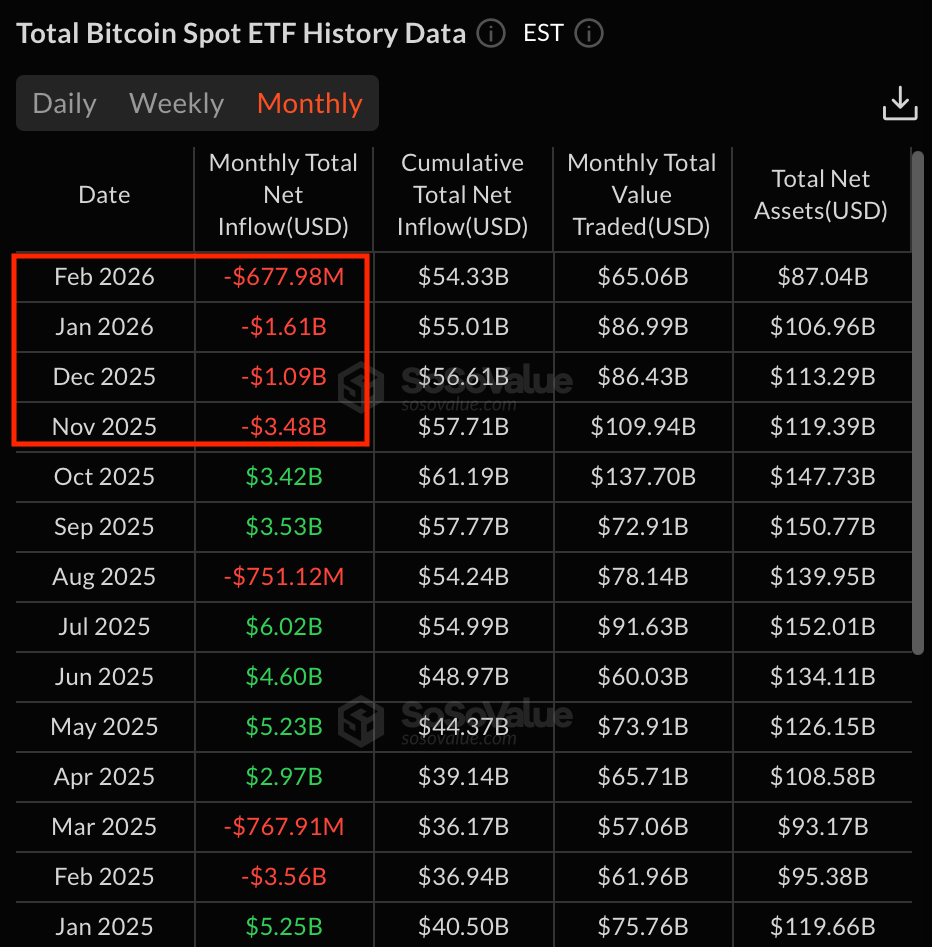
The modern market structure with institutional adoptions add another new layer to this dynamic. With the arrival of spot Bitcoin ETFs in January 2024, early-year performance has increasingly been influenced by institutional allocation cycles. Q1 of 2024 saw approximately $12.13 billion in net inflows, followed by $922.09 million in Q1 2025. This year, however, the trend has sharply reversed. The market has already recorded roughly $2.28 billion in net outflows this quarter, coming after significant withdrawals in November and December. This shift in ETF flow dynamics represents a major departure from the supportive early-year demand that helped underpin prior February strength.
That said ETF flows are only one part of the story. To understand why there’s been such a decline, we need to consider the confluence of headwinds weighing on the market.
When Seasonality Breaks, Macro Usually Dominates
Seasonality tends to work best when the macro backdrop is neutral or supportive. Currently this is not the case. Elevated interest rates, uncertainty around inflation and tighter financial conditions have investors opting toward safer, yield-bearing assets. Bitcoin has entered a maturation phase where it is increasingly interconnected with traditional markets, and while this is favourable for accessibility and adoption, it also comes with the asset class now moving in line with risk sentiment.
This overall macro environment has had a visible impact on market behaviour. Liquidity has tightened, leverage has unwound and realised losses have shot up since the end of January as weaker hands continue to exit positions and add sell side pressure. Therefore, this weak start to the year is much more than a simple seasonal deviation but part of a broader risk-off environment caused by macro uncertainties.
Is this a Bear Continuation Signal?
A weak first quarter for Bitcoin, however, does not definitively signal a continuation of bearish price throughout the year. For example, in 2020, BTC printed a -10.83% Q1 and then went on to rally close to 240% until year end. Similarly, in 2015 and 2016, BTC started with a weak Q1 and ended the year in the green.
That said, it’s important to understand that Bitcoin bottoms are a process and not an event. In other words reaching a cycle bottom can take time to play out. From a pure timeline perspective, Bitcoin is so far following the four-year cycle to a T.
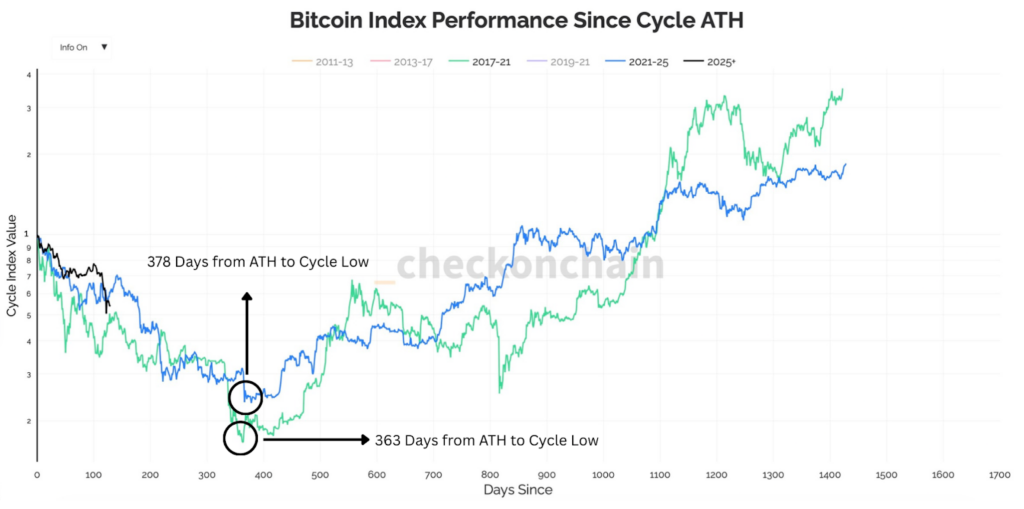
When we look at the prior two cycles, it took Bitcoin approximately 1060 days to hit a new all time high from cycle lows. In the latest cycle, this was 1050 days, showing a strong alignment playing out. Now if we invert this and examine the time from cycle highs to lows, the last two cycles reached a bottom almost around 370 days from previous all time highs. If we were to extrapolate that data, that would point to a potential bottom in October of this year.
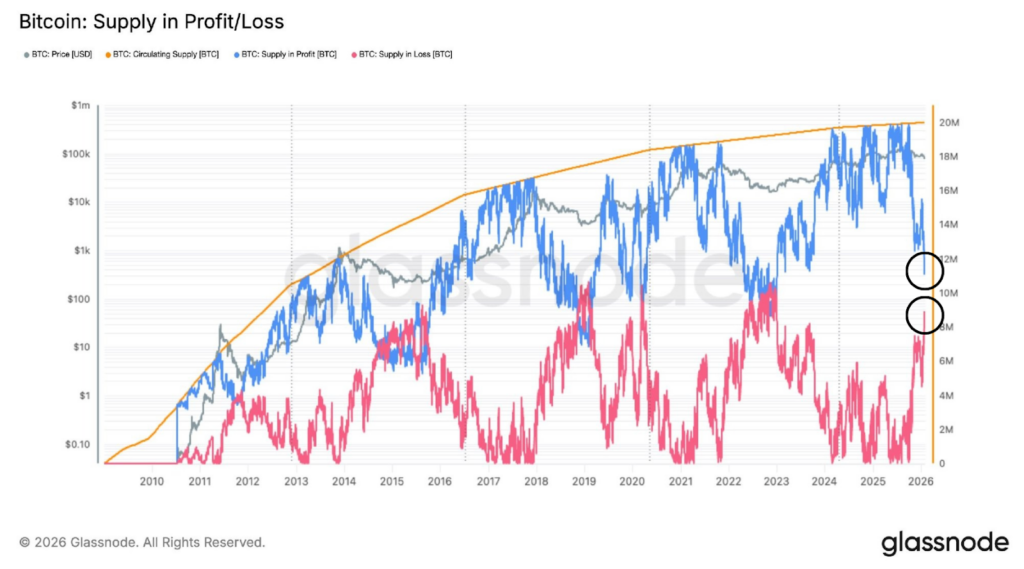
This is not to say that this has to play out again, but the cyclical nature of Bitcoin suggests it is broadly following its usual course, and it would be unwise to ignore it. On-chain signals such as the share of holder supply in profit versus loss, are also reaching levels only seen during bear market lows. That said, it’s important to note that the crossover between these two cohorts takes time to develop and form a base, but nevertheless still signals an opportunistic period for accumulation.
Ultimately, how quickly a bottom forms will depend on macro conditions and whether an easing of uncertainty can drive fresh demand and a return to sustained ETF inflows.
]]>Cango announced that it received over $75 million in fresh equity investments to fuel the growth of its AI infrastructure business.
According to a statement by the firm, it has closed the previously announced Class B equity investment of $10.5 million from Enduring Wealth Capital Limited (EWCL),
The firm also secured equity investments to the tune of $65 million from entities wholly-owned by Cango’s chairman, Xin Jin and company director, Chang-Wei Chiu, bringing the total capital raised to $75.5 million.
The fresh capital signals strong support from company leadership to strengthen its balance sheet and also contribute to its AI business expansion.
CEO Paul Yu stated that Cango also made a treasury adjustment to strengthen its balance sheet and reduce financial leverage with a $305 million sale from its BTC holdings to settle debt obligations. This adjustment is expected to increase the company’s capacity to fund its strategic expansion into AI compute infrastructure.
In a letter to its shareholders, the NYSE-listed company mentioned that it has established EcoHash Technology LLC, a new subsidiary that it fully owns, based in Dallas, Texas, to focus on advancing its AI compute initiatives.
Cango sets up infrastructure to power AI transition
As mentioned in earlier reports, Cango made major strides to end 2025, with its Bitcoin treasury valuation exceeding its stock market capitalization as of early January 2026.
At the time, it also announced plans to create a globally distributed AI-compute network, and this latest development is a step in that direction for the company.
CEO Paul Yu stated that the firm is trying to cover the “Power Gap,” a disconnect between rising AI compute demand and existing grid capacity, and that has informed its latest strategic transformation.
Yu’s sentiments echo opinions shared by Nokia CEO Justin Hotard, who told Reuters that “I fundamentally think we’re at the front end of an AI supercycle, much like the 1990s with the internet.”
Cango plans to leverage its globally distributed mining infrastructure, which spans more than 40 sites across North America, the Middle East, South America, and East Africa, to deliver scalable, low-latency compute capacity to meet what it describes as long-tail inference demand from small and medium-sized enterprises.
While it is committing resources to expand its AI inference compute service to its existing sites, the firm also plans to become an enabler for mid-to-small-sized BTC mining operators seeking a low-cost, modular pathway to diversify their infrastructure to tap into the AI supercycle.
Internal moves lined up for expansion goals
To lead Cango’s AI operations is Jack Jin, who was recently hired as the chief technology officer of its AI business subsidiary. Before his role with Cango, Jin managed large-scale GPU systems and orchestration platforms at Zoom Communications.
Cango is also assembling a dedicated team that will be joining the new CTO in guiding technical execution.
The company ticked off another box after it successfully completed a technical demonstration that validated its core hardware innovation, which is standardized, plug-and-play compute nodes designed for fast deployment across its existing infrastructure.
This will enable the firm to offer on-demand compute capacity by drawing on power from current mining operations. Cango expects the sites to become operational in relatively short timeframes.
The company stated that conversion to AI-ready infrastructure requires limited upgrades, creating the potential to keep developing more revenue streams while addressing enterprise demand for accessible AI compute.
Cango’s transition roadmap
Cango transition is following a three-phase development roadmap, which are the near, medium, and long-term phases, and according to Yu, early results are already emerging.
In the near term, the focus remains on standardization and the efficient deployment of containerized GPU compute nodes as plug-and-play solutions for quick rollout.
The medium-term phase focuses on software-defined orchestration. Cango is developing a proprietary in-house platform to manage and integrate its distributed compute capacity, evolving its role from operator to what it terms an ecosystem enabler. As an enabler, the company will be helping mid-to-small-sized BTC mining operators to diversify their infrastructure into AI at relatively lower costs.
This architecture is designed to offer its global footprint as an integrated, enterprise-grade network without the typical infrastructure complexity associated with distributed computing at scale.
The long-term vision extends to building a mature global AI infrastructure platform by activating underutilized power across its mining ecosystem. The company management expects this strategy to bring in recurring revenue streams from platform services and compute agreements designed to be durable across market cycles.
Yu acknowledged the multi-year nature of the transition, stating, “The transition from mining to AI compute will continue to develop over multiple years, and we are still in the early stages. While the path ahead requires sustained effort, our roadmap is clear, and we are committed to prudent, step-wise execution.”
The announcement follows Cango’s completion of several foundational milestones in 2025, including acquiring and enhancing the hashrate efficiency of 50 exahash per second of on-rack machines, securing an initial 50 megawatts of energy infrastructure, divesting legacy operations, and completing its transition to a direct NYSE listing.
Cango still maintains strong interests in its AutoCango.com international used car export business alongside its digital asset operation.
]]>Held on February 11-12, 2026, the event took place across three regional X Spaces sessions covering EMEA, the Americas and APAC audiences. Ripple CEO Brad Garlinghouse, President Monica Long and XRPL co-creator David Schwartz were accompanied by representatives from major crypto and fintech companies like Grayscale and Gemini. The central themes throughout the event spanned across regulated financial products, ETFs, wrapped XRP, DeFi application, cross-chain liquidity and the expanding role of XRP in capital markets and real-world payments. The sessions also included live Q&As with Ripple’s leadership team and highlighted the company’s priorities for 2026 around institutional adoption and on-chain infrastructure.
Events like these in the crypto space often come with price volatility, sometimes even before the event begins, as expectations build around potential announcements, partnerships and ecosystem updates. XRP entered Community day in a consolidation phase after a volatile move to the downside and currently hovering around the key technical support level of around $1.35.
So far, the broader macro uncertainty and risk off sentiment that is coming down on the crypto market have outweighed the immediate impact of the announcements from the event. That said, optimism from such events often requires time to materialize and typically depends on whether the developments signal actual, structural demand rather than short-lived sentiment.
Event Optimism Building Within the Community
Despite price not reacting to the event from the get go, there was a clear message that came out from Community Day 2026. Throughout the event, the idea of the XRP Ledger being more than just a payments network and as an infrastructure for regulated finance came through. Institutional adoption, cross chain expansion and new developer tooling to strengthen XRPL’s role in tokenized assets were the core themes covered during the two day event. There were also discussions around its roadmap with emphasis being placed on programmability updates, compliance-friendly features and continued investment in the developer ecosystem. The themes and talking points ultimately showed a long term strategy focused on expanding enterprise and institutional use cases.
A major partnership was also announced during the event between Ripple and Aviva Investors, the global asset management wing of Aviva plc. The partnership aims to explore the tokenization of traditional fund structures on the XRP Ledger. This marks Ripple’s first partnership with a European investment manager and highlights a deeper push into tokenized finance. For Aviva investors, the initiative represents its first step toward incorporating on-chain fund structures. This partnership once again exemplifies the long term narrative of XRP becoming a key player bridging traditional finance and blockchain-based infra.
Historical Impact of Major XRP Events
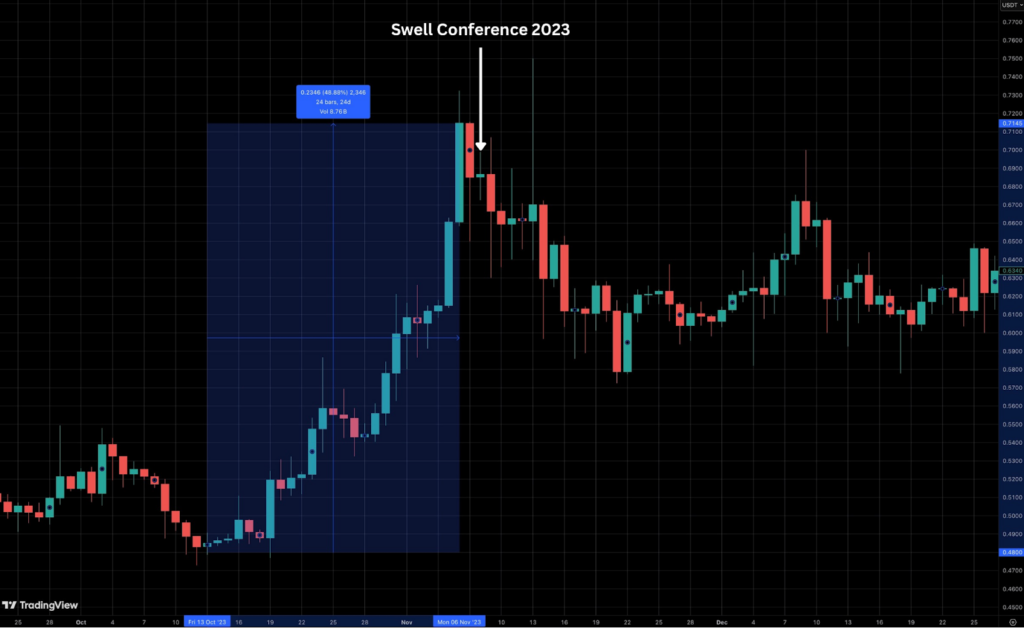
History often suggests that crypto events can play into the “buy the rumor, sell the news” dynamic and this has been observed in previous XRP events as well. For example, Ripple’s annual Swell conference has acted as a short term price catalyst in the past. Take Swell 2023 for instance, XRP rallied by nearly 50% for four weeks leading up to the conference, only to be followed by profit taking.
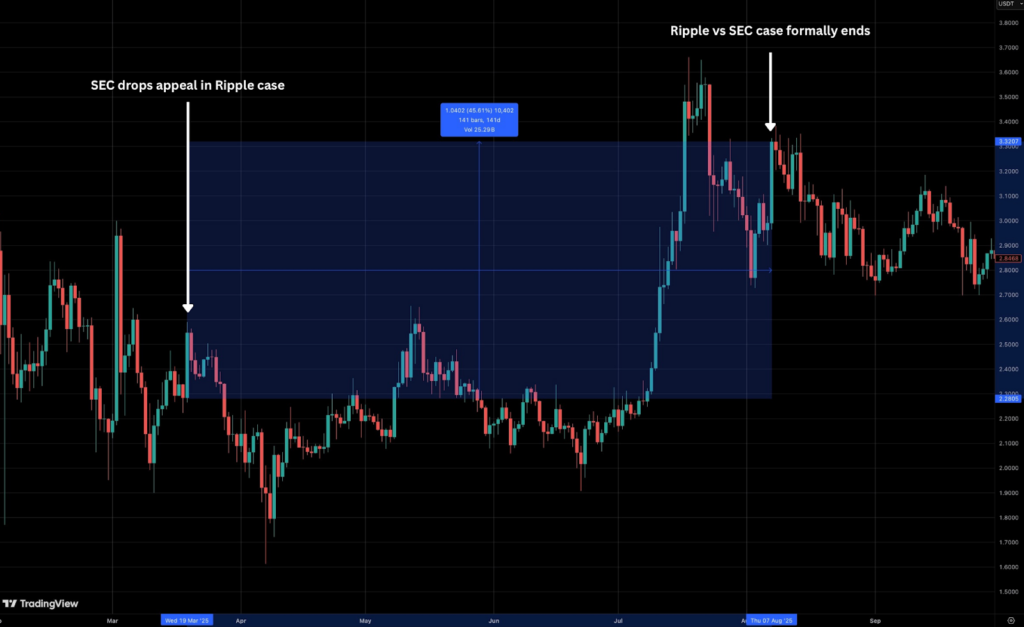
However, news around regulatory clarity had a much more long term impact and momentum to price. The news around the U.S. SEC dropping the long standing Ripple lawsuit in March 2025 not only had an immediate impact on price but saw a durable momentum all the way up to August of the same year when the case was officially closed. During this period XRP’s price rallied by nearly 46%.
Market Structure Remaining the Deciding Factor
Even though the Community Day might’ve brought in fresh narratives, the broader macro environment continues to influence market structure and sentiment across asset classes including crypto. The entire crypto sector remains heavily influenced by global liquidity conditions, interest rate expectations and risk appetite.
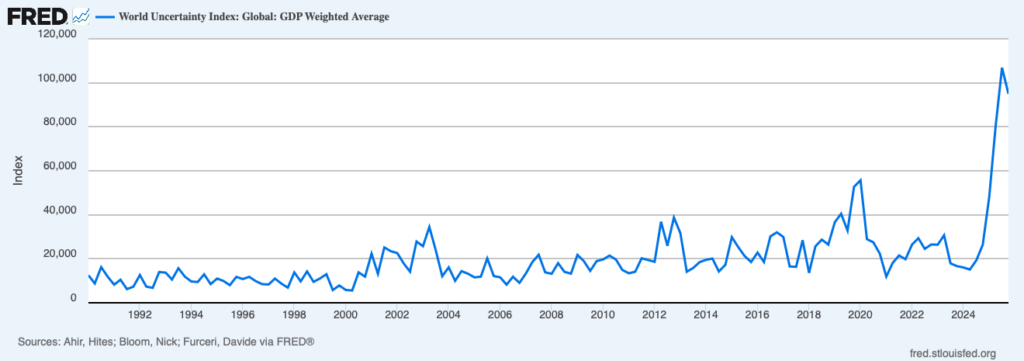
Currently, global uncertainty is impacting the crypto market. Economic unpredictability is at unprecedented levels and this is indicative by looking at the World Uncertainty Index. This index is used as a barometer to judge global economic uncertainty by tracking how frequently uncertainty related terms appear on economic and policy reports across the globe. For perspective, this index is now higher than levels seen during both the pandemic and the 2008-2009 financial crisis.
Ultimately, this level of fragility in the macroeconomic environment makes it extremely difficult for any sort of event-driven news to gain traction. Global sentiment and external macro forces currently remain the key parameters to keep close eyes on for a momentum shift in XRP and the broader market.
Levels Traders are Watching
After breaking the April 2025 lows of $1.61 on February 1st, price has dropped by another 15% and is now testing a key support zone between the $1.30 to $1.35. Traders are watching this level because this coincides with a cluster of price activity all the way back to August-October 2021. Zones with repeated historical reactions often become important battlegrounds between buyers and sellers.
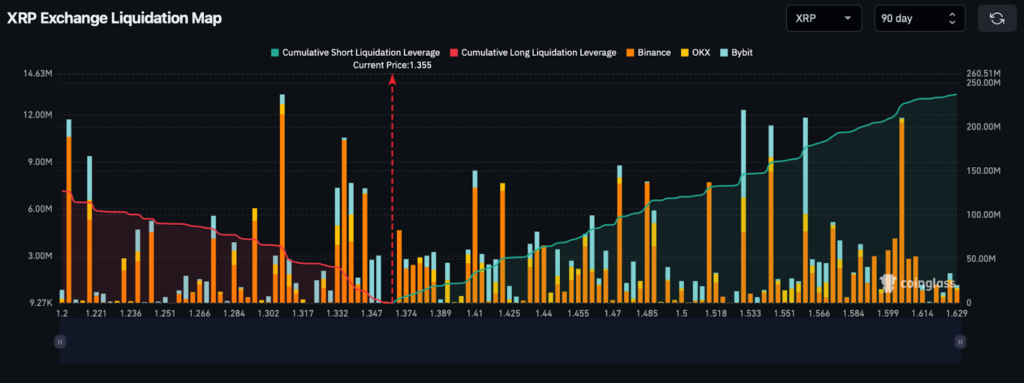
Derivatives positioning also highlights similar areas of interest and where we could potentially see volatility. When we look at XRP’s three-month liquidation heatmap, a large portion of long liquidations has already been cleared by the recent decline. However, a pocket of long leverage still sits below the current market price, particularly in the $1.30 to $1.25 region. At the same, significant short liquidation clusters are emerging between $1.50 and $1.63.
]]>
CreateOS, which officially launched on Product Hunt on February 4, 2026, achieving the #1 ranking on launch day and enabling hundreds of public projects within days, offers an AI-assisted workflow from idea creation to coding, deployment, scaling, and production management. Users build applications through no-code interfaces or AI-guided prompts, without needing deep technical expertise. While the platform supports optional decentralized cloud options for potential cost savings, it does not require users to adopt them—allowing flexibility based on needs and preferences.
In this textile pilot, factory operators used CreateOS to connect CCTV systems to cloud storage, creating custom dashboards for production oversight. As adoption of this digital surveillance layer matures, the subsequent phase will progressively enable automated detection and alerting of operational anomalies—ranging from unauthorized access and material handling irregularities to potential theft events, equipment stoppages, and line-level malfunctions—bringing factories closer to a fully responsive, data-driven operating model.
“We used NodeOps to store CCTV recordings from our factory. Even though the site is in a remote area, the backups are getting stored properly. The dashboard built with CreateOS is simple and easy for our team to use,” said Anand, owner of a cotton processing facility in Maharashtra.
“NodeOps has made it easier for us to manage CCTV footage across our factory locations. The dashboard built with CreateOS is clean and straightforward,” added Gautam, who operates five cotton manufacturing facilities in Telangana.
This early use case underscores the NodeOps team’s focus on building for real-world impact, extending AI capabilities to non-technical users in traditional industries. By repurposing existing infrastructure, CreateOS addresses visibility gaps in shop-floor operations, where quality control, compliance, and worker accountability have often depended on fragmented records.
The pilot’s success comes amid growing demands for supply-chain documentation, particularly as India negotiates trade agreements with the EU that require verifiable evidence of working conditions and processes. For U.S. manufacturers facing similar challenges, it raises a practical question: How can accessible AI platforms like CreateOS help small operations achieve comparable gains in transparency and decision-making without significant upfront investments?
“What matters is solving immediate problems with familiar tools,” said Naman Kabra, CEO of NodeOps. “CreateOS handles the complexity of AI-assisted development end-to-end, so users can focus on their operations—whether that’s building a monitoring dashboard or scaling an application in production.”
As CreateOS reaches new audiences post-launch, including developers and businesses worldwide, this MSME deployment highlights its potential to bridge operational divides in global manufacturing. NodeOps continues to explore applications across sectors, prioritizing user-centric design.
About NodeOps
NodeOps is a digital infrastructure company enabling AI-powered applications for real-world environments. CreateOS provides an end-to-end platform for building, deploying, and managing projects with AI assistance, accessible to users regardless of technical background. For more information, visit nodeops.network, nodeops.network/createos, or createos.nodeops.network.
Contact:
Alex Albano, Head of Marketing
NodeOps
[email protected]
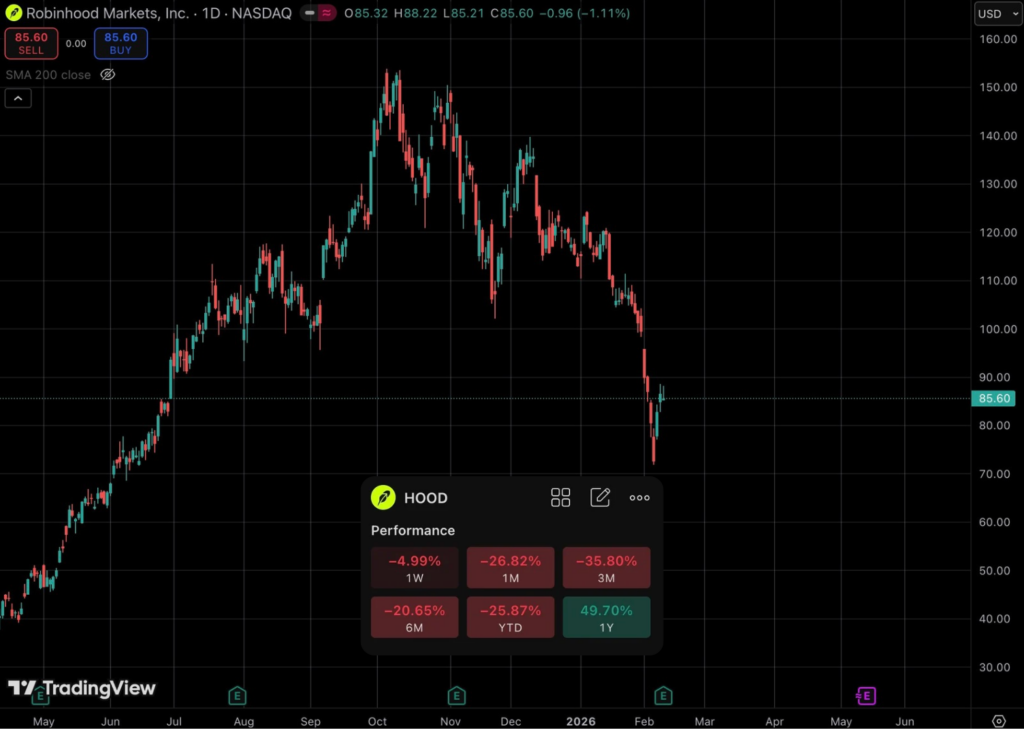
The latest earning results clearly show this gap between growth and expectation. Despite reporting record revenue growth in Q4, it still disappointed analysts at Wall Street after missing forecasts. The slowdown has largely come from a decline in crypto trading volumes which was once a powerful growth engine for the platform.
The real question that most investors are grappling with at the moment is whether the company’s long term expansion story matters more than the short term pressures hitting its core business. To answer this question, it’s important to understand the different structural concerns and cyclical factors that are currently being a detriment to Robinhood’s stock.
Earning Expectations and Revenue Pressures
While the crypto markets have experienced a volatile period since Q4, specifically since the liquidation cascades of October 10th, global markets including U.S. indices have also felt higher degrees of volatility during this period. A combination of geopolitical tensions, news around an AI bubble brewing and recently, the potential of a hawkish Fed chair with the appointment of Kevin Warsh which could have a direct impact on future interest rate decisions, have all triggered uncertainty across markets.
The reality of why Robinhood is seeing such a steep sell off since posting an all time high in October is actually quite simple to understand. Robinhood’s revenue is deeply intertwined and influenced by market activity. In other words, when transactions and trading volumes are strong, the business can grow quickly. Conversely, when activity cools, revenue becomes a lot more unpredictable.
The fact is even though markets have experienced a volatile backdrop, equities and options trading rose on the platform, but overall results still fell short of revenue expectations of $1.34 billion. What did swing the pendulum here was crypto activity. Reports show that cryptocurrency transaction revenue fell sharply with quarterly revenue coming in at $221 million and missing analysts’ expectations $248 million. This matters because crypto trading has historically acted as a major growth engine during bull markets. However, this slowdown has reminded investors of just how cyclical Robinhood’s revenue can be, driving the shift in sentiment toward the stock.
At the same time, interest income has quietly become a huge stabilizer for the business. Net interest rose sharply by 39% year-over-year to $411 million as the company earned more from customer cash balances, margin loans and securities lending. It’s important to note here that this actually creates a new dynamic. As net interest revenue becomes a bigger part of the business, a bigger chunk of its profits now depends on where interest rates go.
Regulatory and Policy Overhang
Another dynamic at play for Robinhood’s stock valuation is the presence of regulatory and policy uncertainty toward the trading platform. Scrutiny from regulators around investor protection, disclosures and compliance remains a constant for trading apps. In 2025 alone, Robinhood agreed to pay $45 million in SEC penalties for multiple securities-law violations which included reporting failures and gaps in compliance. Ongoing investigations and regulatory actions highlight a simple reality for Robinhood stock investors in that this is still a heavily monitored business operating in a constantly changing policy environment.
Another practice that has garnered stern questions from regulators is the payment for order flow (PFOF) practice. Questions around conflicts of interest continue to come up with regulators exploring a potential rule change or tighter oversight. Ultimately, any regulatory shift that can introduce new rules acts as a persistent headwind for Robinhood. Therefore, even when the company executes well operationally, policy uncertainty can cap investor enthusiasm.
Crypto Exposure Adding Volatility
The crypto market has witnessed structural reset to the downside ever since peaking in October last year. Sentiment in the crypto market is currently the weakest it has been since the 2022 bear market lows and search trends reveal that retail interest has been waning as well. Crypto trading on Robihood has become a meaningful revenue contributor, however the swings in crypto directly translates to volume on the platform and thereby the pace of revenue growth. This link reinforces the perception that the stock is increasingly tied to how crypto moves and is in tandem with the overall performance of the broader digital asset market.
Broader Fintech and Market Sentiment
Robinhood’s stock decline is happening at a time when there is a noticeable change in sentiment toward growth and fintech stocks. The tech sector has faced increasing pressure as investors reassess valuations, rising economic uncertainty, and the pace of returns from heavy AI spending. Recent market volatility and a wider tech selloff highlight how risk appetite has cooled, particularly for companies seen as high-growth or sentiment-driven.
Expectations around future interest-rates are another crucial factor shaping sentiment. The appointment of Kevin Warsh as the new Fed chair and his hawkish reputation has further added to this narrative. As markets price in the possibility of a tighter monetary policy and a slowing economy, investors are increasingly rotating toward safer and more predictable businesses.
The risk-off sentiment is particularly coming down hard on fintech platforms where growth trajectories depend a lot on retail participation, market trends and trading activity. In this sort of backdrop, the decline in Robinhood’s stock reflects not just company-specific concerns but a broader recalibration of how investors view retail-focused, growth-oriented financial platforms.
When it comes to Robinhood’s crypto vertical and ambitions, there seems to be no signs of slowing down despite the recent sharp drop in the crypto markets.
Today’s announcement on the launch of its own chain, an Ethereum layer 2 built on Arbitrum to bring tokenized assets, 24/7 trading and deeper integration between TradFi and DeFi shows their long-term crypto strategy. For investors, on the face of shifting sentiment, this is a clear indication that the company is doubling down on its efforts to invest in the next phase of its growth story.
]]>According to Coinbase Markets, the $RAVE-USD spot trading pair is expected to open on or after 9:00 AM PT in regions where trading is supported. $RAVE will be available on coinbase.com, the Coinbase mobile app, and Coinbase Advanced, while institutional clients will be able to access trading directly via Coinbase Exchange.
Coinbase has specified that the Base network contract address for RaveDAO ($RAVE) is:
0x1aa8fd5bcce2231c6100d55bf8b377cff33acfc3
Users have been advised not to send $RAVE over other networks, as unsupported transfers may result in permanent loss of funds.
RaveDAO’s Cultural and Community-Driven Model
RaveDAO emerged in 2024 as a live entertainment and cultural network built at the intersection of music, community, and Web3 infrastructure. Since its first sold-out event in Dubai in 2024, the project has expanded rapidly across Europe, the Middle East, North America, and Asia, hosting large-scale experiences that consistently draw thousands of attendees per event.
Rather than treating live events as isolated moments, RaveDAO uses them as an entry point into an ongoing on-chain ecosystem. Event participation is recorded through NFTs that function as proof of attendance and evolving identity markers, connecting real-world cultural experiences with digital ownership and long-term engagement. This model allows participation to persist beyond a single night, city, or lineup.
Beyond entertainment, RaveDAO integrates social impact into its operational design. A portion of proceeds from its events is directed toward philanthropic initiatives, aligning community participation with measurable outcomes. To date, RaveDAO-supported efforts have helped restore sight for more than 400 cataract patients through the Tilganga Eye Centre in Nepal and funded meditation and Buddhist education programs for over 150 participants through Nalanda West in the United States.
The Role of the $RAVE Token
$RAVE is designed for participation. Its purpose is not to incentivize short-term activity, but to align ownership with contribution across RaveDAO’s cultural and operational ecosystem. The token functions across three interconnected layers: business infrastructure, community experience, and decentralized governance. At its core, $RAVE allows participants to take part in building, operating, and shaping the culture they support, creating a shared framework where value is generated through involvement rather than passive consumption.
On the infrastructure and experience layers, $RAVE enables both scale and continuity. Event organizers, artists, and partners use the token to access RaveDAO’s intellectual property, activate local chapters, and collaborate under a shared global standard. Community members use $RAVE to unlock access, participate in events, engage with artists, and interact with digital collectibles. Participation is treated as contribution, whether through attendance, chapter-building, or sustained engagement across the network.
Governance forms the third layer, anchoring the ecosystem in collective decision-making. $RAVE holders participate in shaping the direction of RaveDAO, including event locations, programming priorities, ecosystem grants, and philanthropic initiatives. As the network expands across regions and formats, the token functions less as a speculative instrument and more as cultural infrastructure, recording participation and enabling coordination over time.
From Cultural Protocol to Global Infrastructure
Since its launch, RaveDAO has hosted world-class experiences for more than 100,000 total attendees, with average event attendance exceeding 3,000 participants. The project has collaborated with internationally recognized artists including Vintage Culture, Don Diablo, Chris Avantgarde, Lilly Palmer, Charlotte de Witte, Miss Monique, Eli Brown, MORTEN, Bassjackers, and GENESI, and has received support from leading Web3 organizations such as WLFI, Binance, OKX, Bybit, Bitget, and Polygon. RaveDAO also maintains active partnerships with leading entertainment platforms and global partners including 1001Tracklists, AMF, and Warner Music.
With spot trading for $RAVE set to begin on Coinbase on February 11, 2026, the token’s availability on a major regulated exchange marks a significant milestone in RaveDAO’s evolution from a global cultural movement into a widely accessible digital asset with real-world utility and community-driven foundations.
]]>